Projects
Preparing the portfolio shell before the interactive work loads.
Preparing the portfolio shell before the interactive work loads.
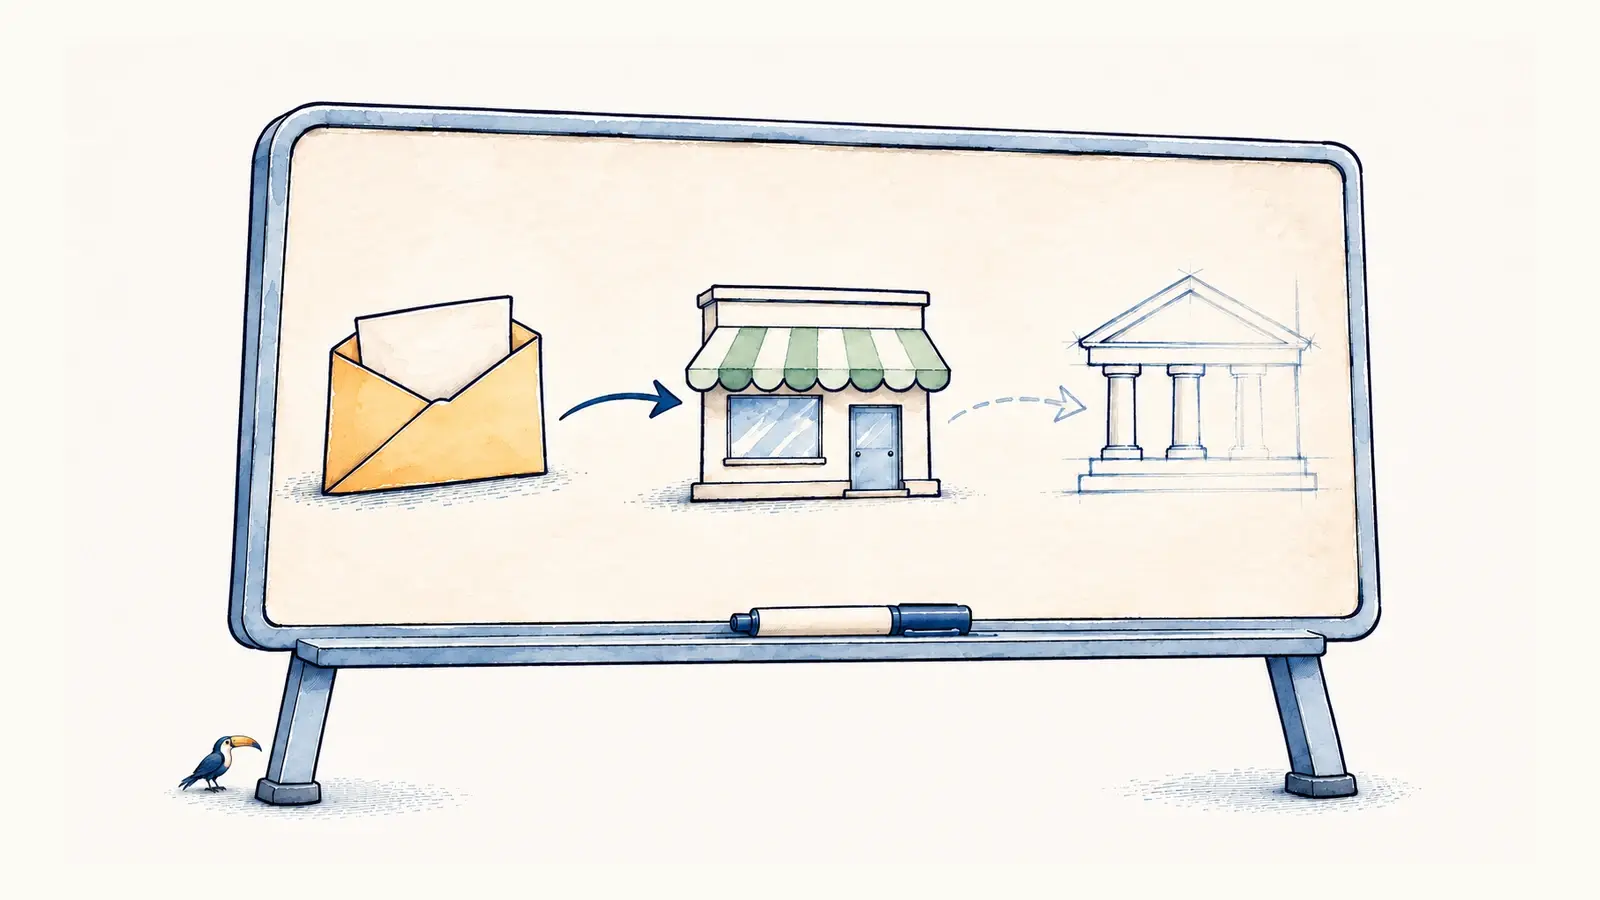
An exploration in visual explanation
Drawing an explanation as the story unfolds.
I’m exploring whiteboard animation as a way to illustrate future experiment results. Drawing an explanation step by step could help show what changed, how it worked, and what the numbers support.
The first example follows California earnings through payroll taxes, income taxes, a taxable purchase, and the seller’s profit. Compare the next dollar earned with a full year’s salary, or enter a salary and choose a household.
For future experiment readouts, I want the drawing to connect the hypothesis, the change, the observed result, and its uncertainty. The aim is to make the reasoning easier to follow while keeping the evidence visible.
The demo uses a simplified 2026 California tax model and an assumed taxable purchase at 9.75% sales tax. Its calculations, sources, and assumptions are included in the experience. Recorded narration accompanies selected examples; custom salaries update the drawing without voiceover.