Article
November 3, 2026
4 min read
Drawing the Logic Behind a Complex Decision
Narrated drawings offer a way to inspect complex systems by revealing relationships in sequence and letting people reason through a changed case.
By Cristiano Pierry

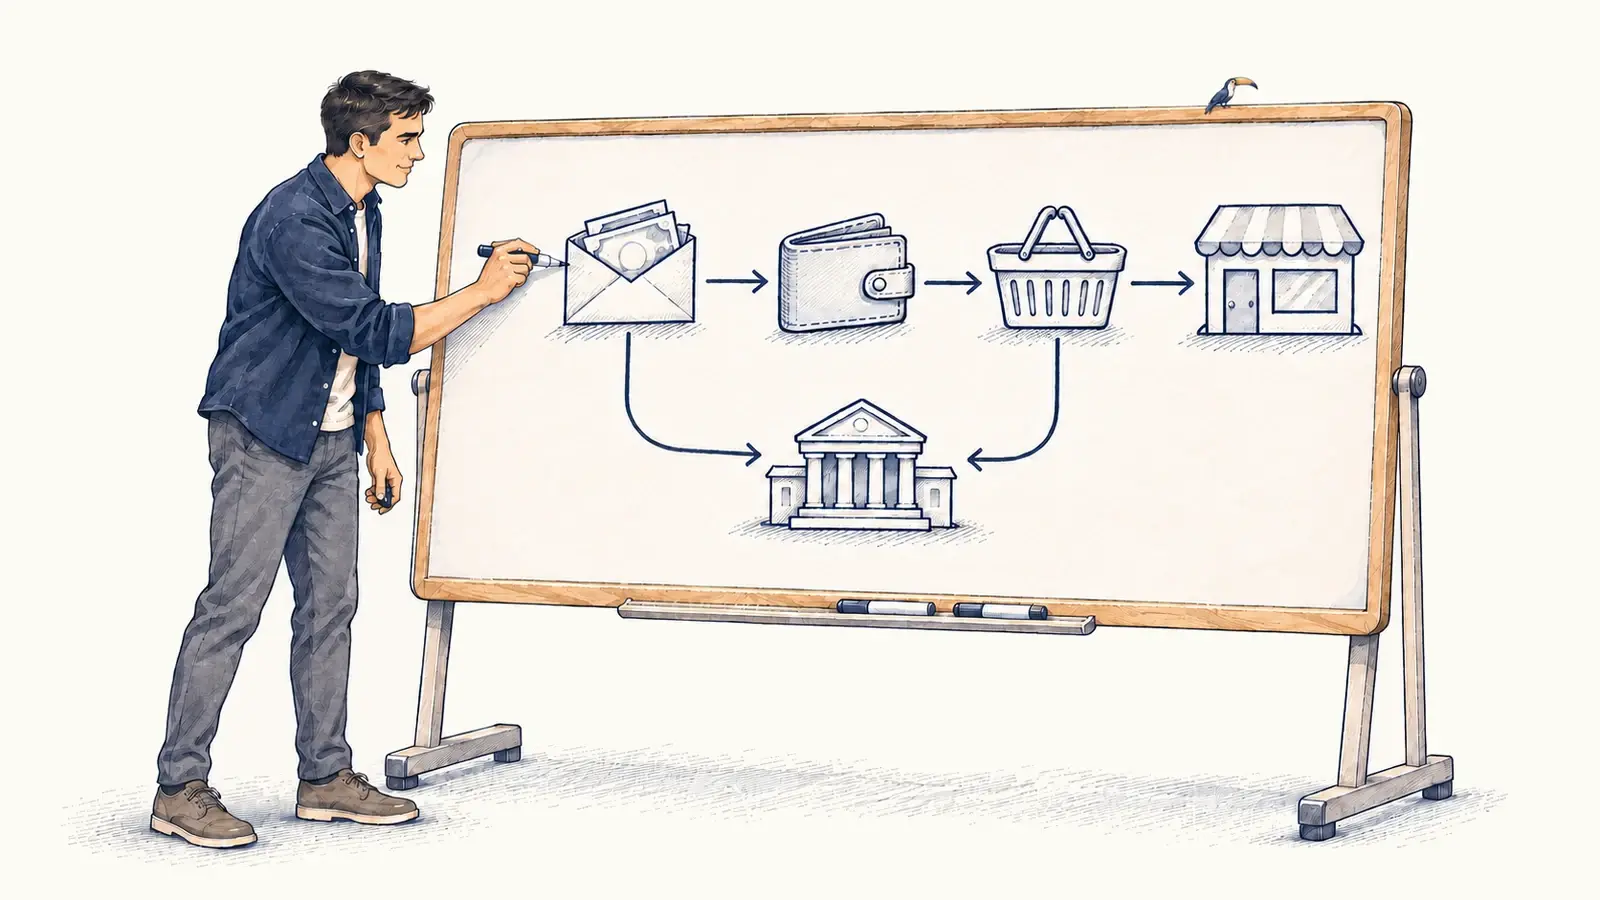
I continue to look for ways to make complex algorithms easier to explain. This time, I wanted to experiment with a whiteboard-style explanation: a drawing that takes shape as a narrator walks through the idea.
With Election Day here, I chose “How Taxes Work” as the subject. I wanted to follow a dollar. Someone earns it, pays taxes, buys something, and leaves the seller with another tax obligation.
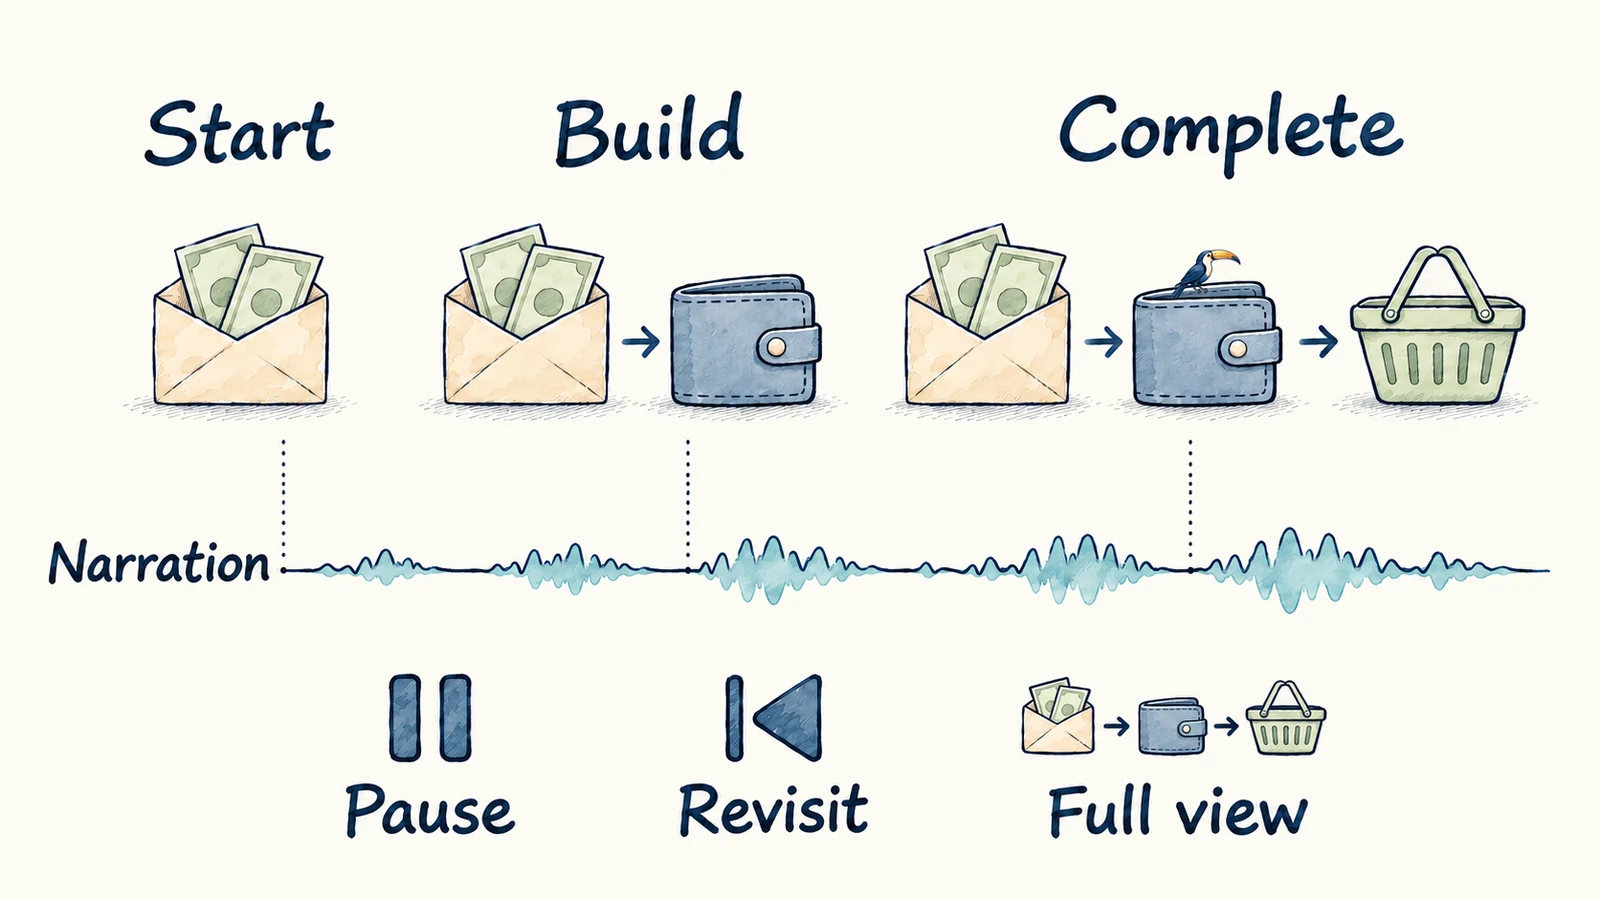
What interests me is how this format could help people follow the logic of a complex system. A finished diagram presents many relationships at once. A drawing that develops alongside narration lets us introduce those relationships in an order the audience can follow, while keeping the earlier parts available for reference.
For an algorithm, I want someone to understand how a particular result came about and where a different rule or input could change it. An executive deciding whether to support a product change should be able to question that logic.
The order is part of the explanation
I would begin with a question the audience needs to answer. Why did this recommendation appear? What happens to the money after someone earns it? The question gives the drawing a purpose and helps determine which relationships belong in the explanation.
In the tax example, wages establish the starting point. Paycheck deductions leave an amount to spend, and a taxable purchase introduces sales tax. The seller’s profit and tax belong to a separate branch. Introducing those relationships one at a time gives the audience a way to follow the money without treating every tax as another deduction from the buyer’s purchasing power.
The sequence has to preserve the system’s logic. Putting a constraint at the end of an algorithm walkthrough can imply that the system first makes an unconstrained choice and then corrects it. If the actual system applies the constraint earlier, the drawing should show that or identify the sequence as a simplification.
Narration can explain why a relationship matters while the drawing makes it visible. Earlier elements give people something to refer back to as the explanation develops. Controls to pause, revisit a step, or see the completed picture let them choose when to stay with a detail and when to consider the whole system.
Try changing the rule
Consider a hypothetical recommendation experience for someone who has twenty minutes available. A drawing could begin with three options: a ninety-minute film and two episodes that fit the available time.
The film is removed because it exceeds the time limit. Of the remaining episodes, the model ranks one higher, but a rule prevents repeatedly offering the same title. That episode has reached the limit, so the other one appears. The audience can see how an eligibility requirement, a model’s preference, and a product rule contribute to the result.
Now there is something specific to discuss. How much exposure is enough? When should a title become eligible again? Should the ranking model account for fatigue differently? The explanation gives those questions a place in the drawing.
I would then change one condition. Remove the repetition limit and ask which episode should appear. Or give the person ninety minutes and ask which additional option becomes eligible. Before replaying the drawing, let the audience predict the result and explain its reasoning. That gives us a way to examine whether the explanation was understood.
This is a hypothetical example, not a description of a production recommender. An explanation of what a real system did needs to be connected to its actual behavior. A plausible sequence of drawings should not stand in for evidence of how a learned model reached a result.
There are also questions for which I would begin with a static view. Comparing several outcomes or checking exact values may be easier when the whole table or diagram is available at once. Keeping the completed picture available lets the audience move between following the sequence and inspecting the relationships together.
I want to use this approach for future experiment results too. I would draw the product change and the mechanism we expect it to affect, then show the measured result separately. The audience should be able to distinguish the proposed explanation from what the experiment measured, including uncertainty and important differences between groups.
I have not yet tested whether this format improves executive comprehension. I would judge it by whether someone can explain the decision and reason through a changed case. If they can repeat the story but misidentify which rule changed the outcome, that part of the explanation needs more work.
This writing reflects my personal perspectives on product management, AI, and content discovery. It does not represent the official position of my employer or any affiliated organization.