Projects
Preparing the portfolio shell before the interactive work loads.
Preparing the portfolio shell before the interactive work loads.
macOS utility · Open source
A record of what happened to your network.
Intermittent problems are hard to investigate after the connection recovers. Network Monitor keeps a local history of reachability, response times and interruptions, so there is evidence to inspect when the moment has passed.
The problem
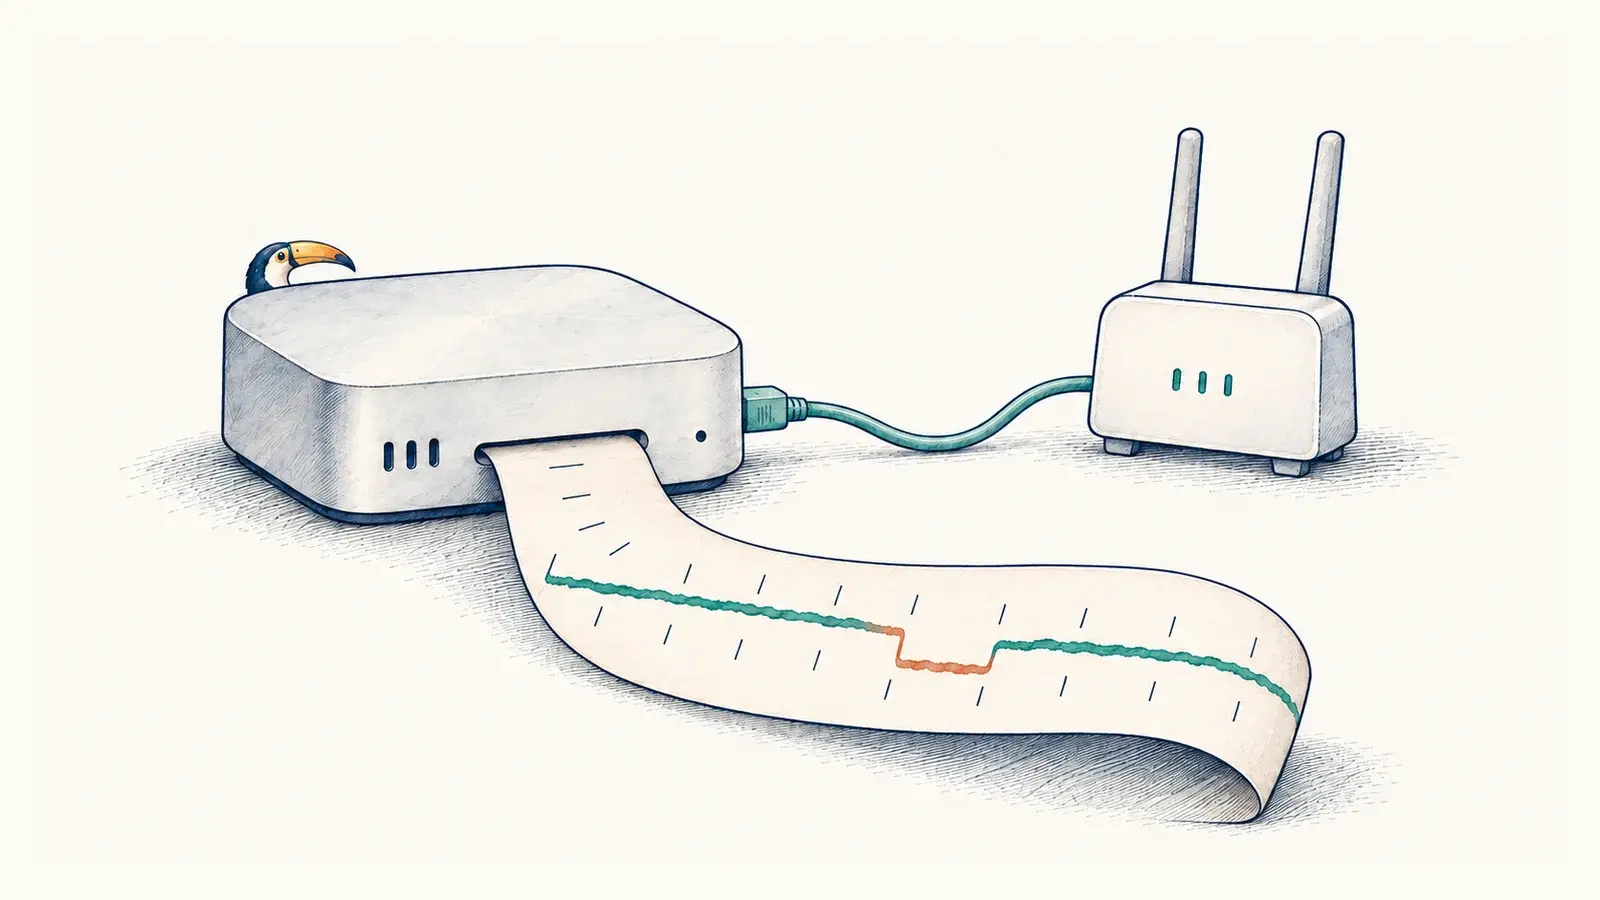
A dropped call can leave several plausible explanations: the computer, Wi-Fi, the router, the upstream connection or the service itself. A speed test taken later measures a different moment. Network Monitor preserves observations over time and keeps each check’s result available for inspection.
The app runs on one Mac, with no cloud account, router password or subscription. Recording continues when the dashboard is closed and when internet checks fail, as long as the Mac is awake and the recorder is running. A second observer is optional.
Inside the application
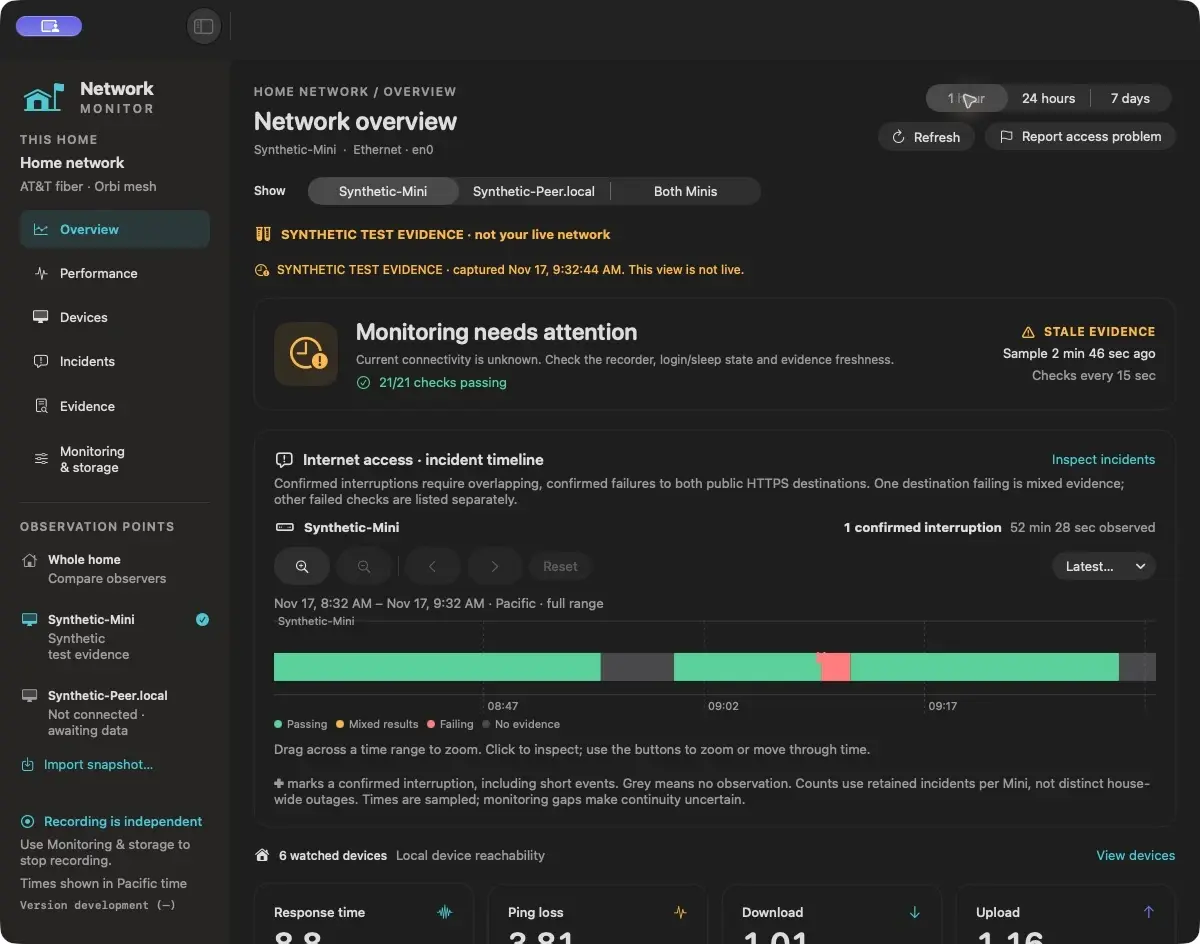
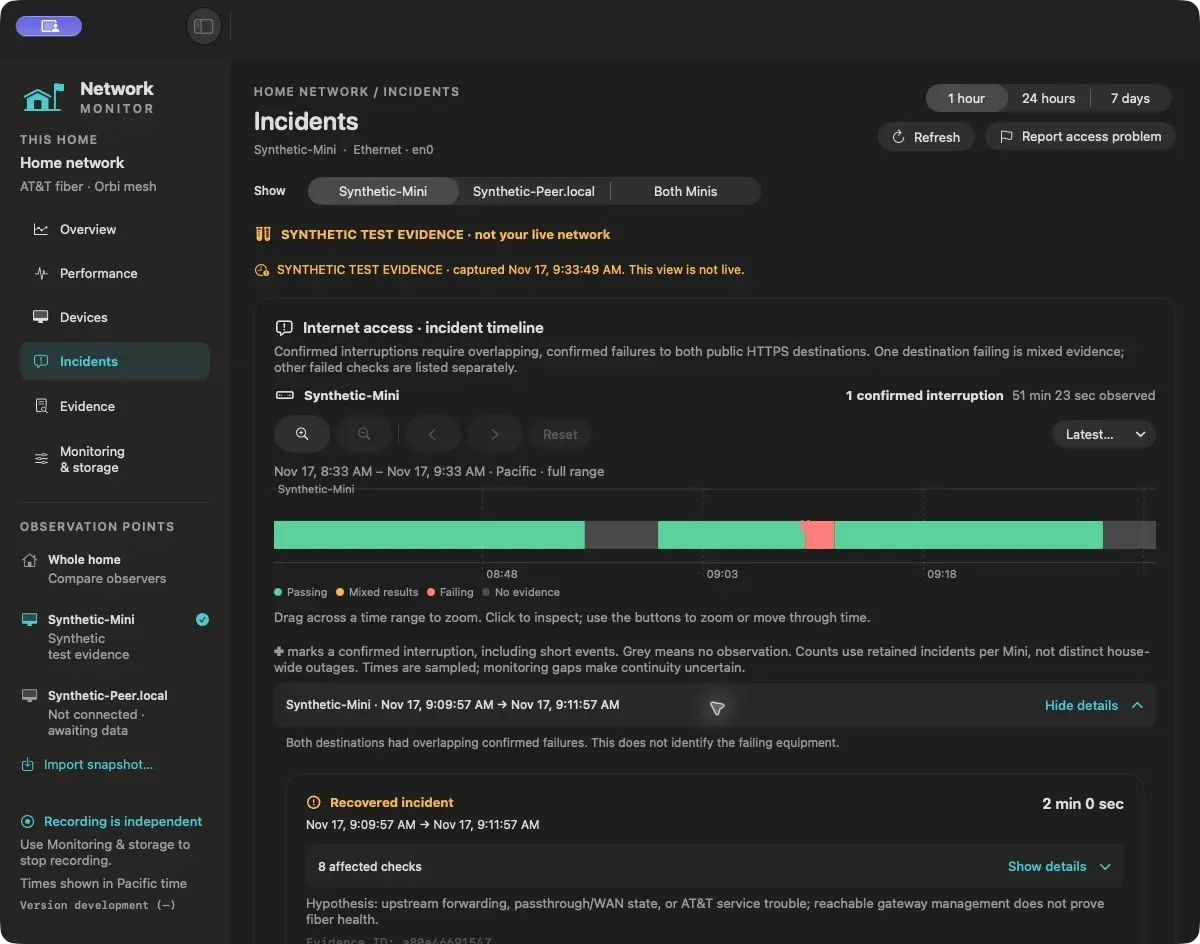
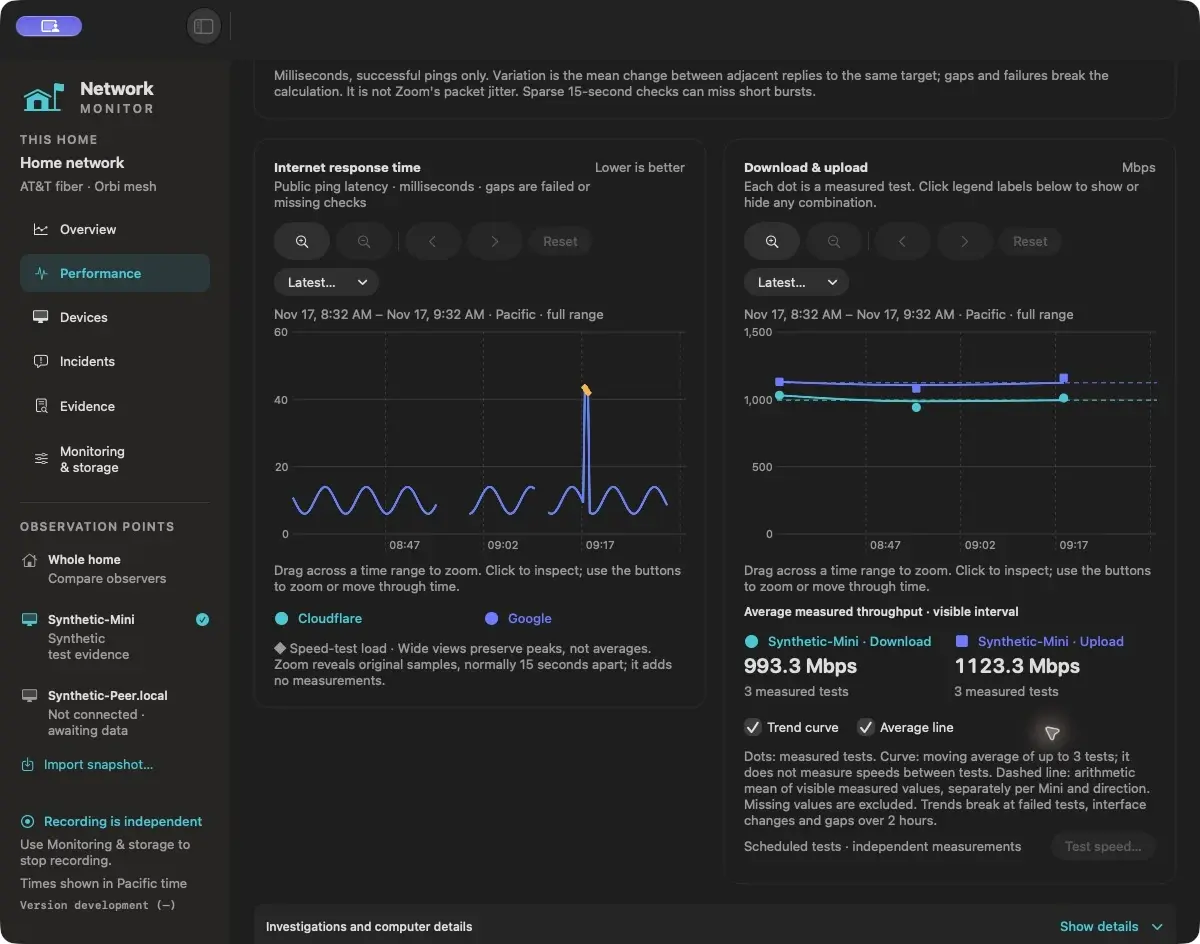
Overview, Performance, Devices and Incidents offer different views of the saved record. Change the observer or time range, zoom into a short event, and expand the affected checks.
How it works
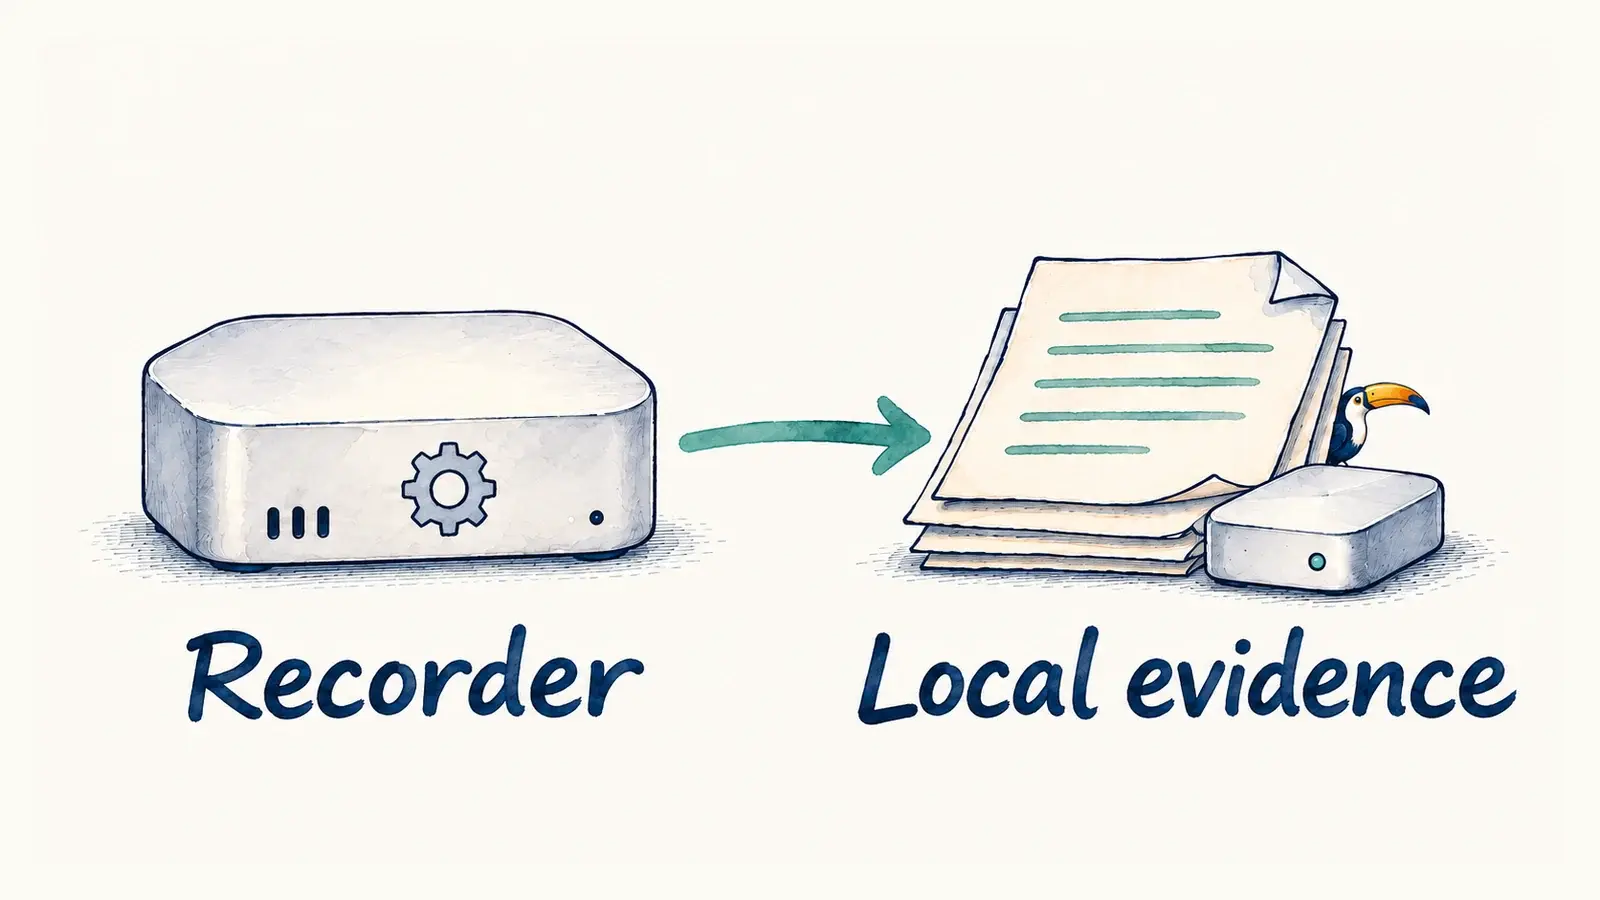
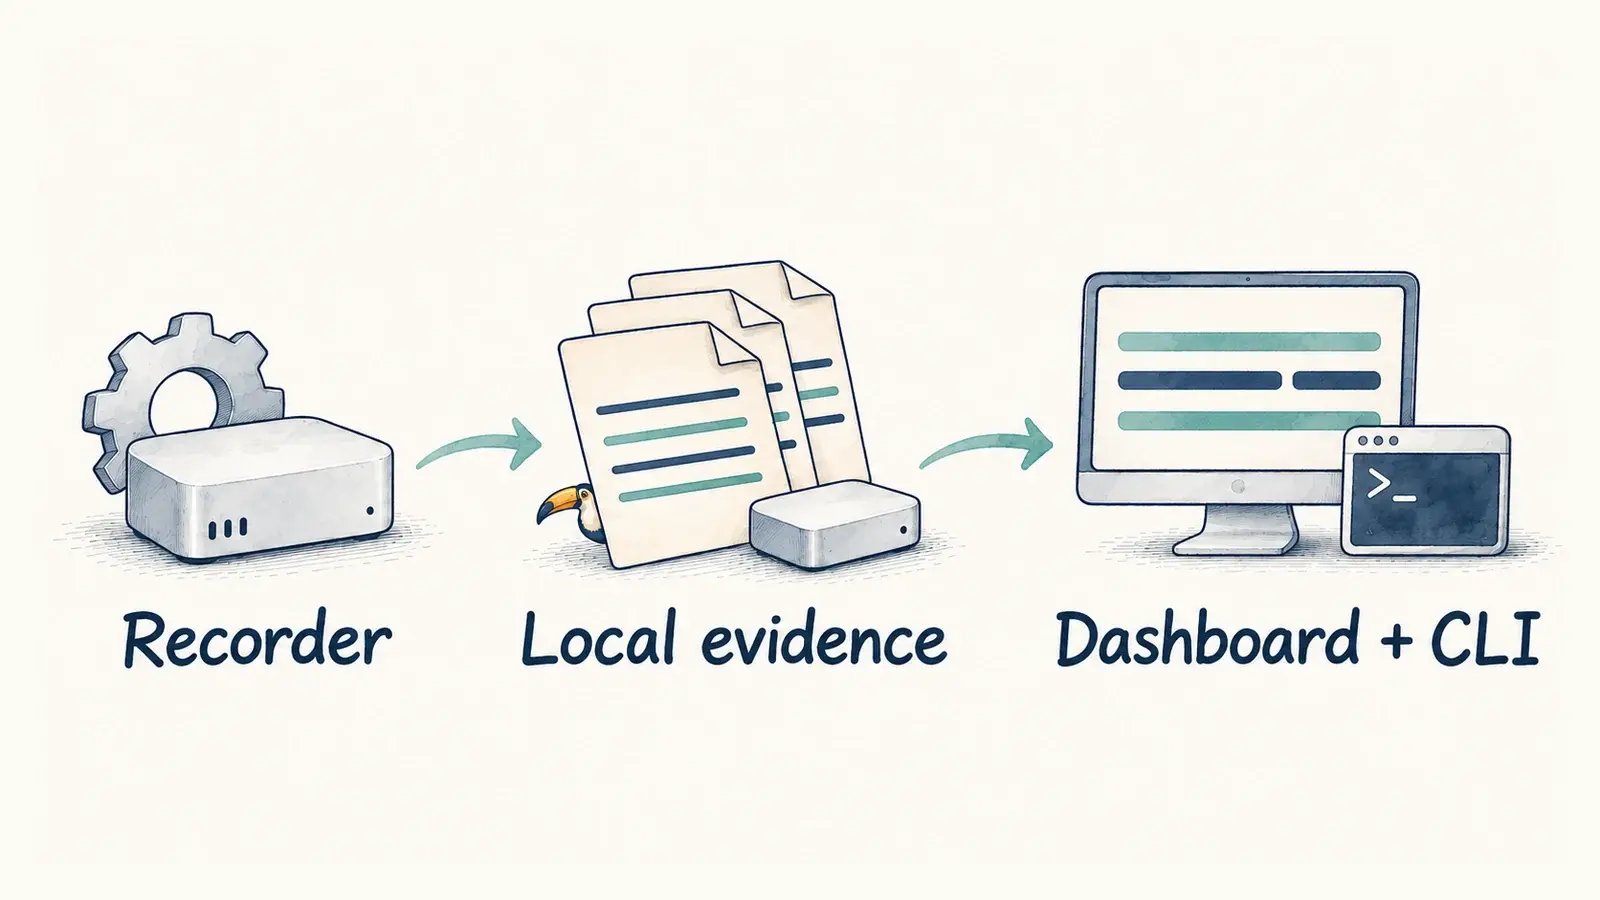
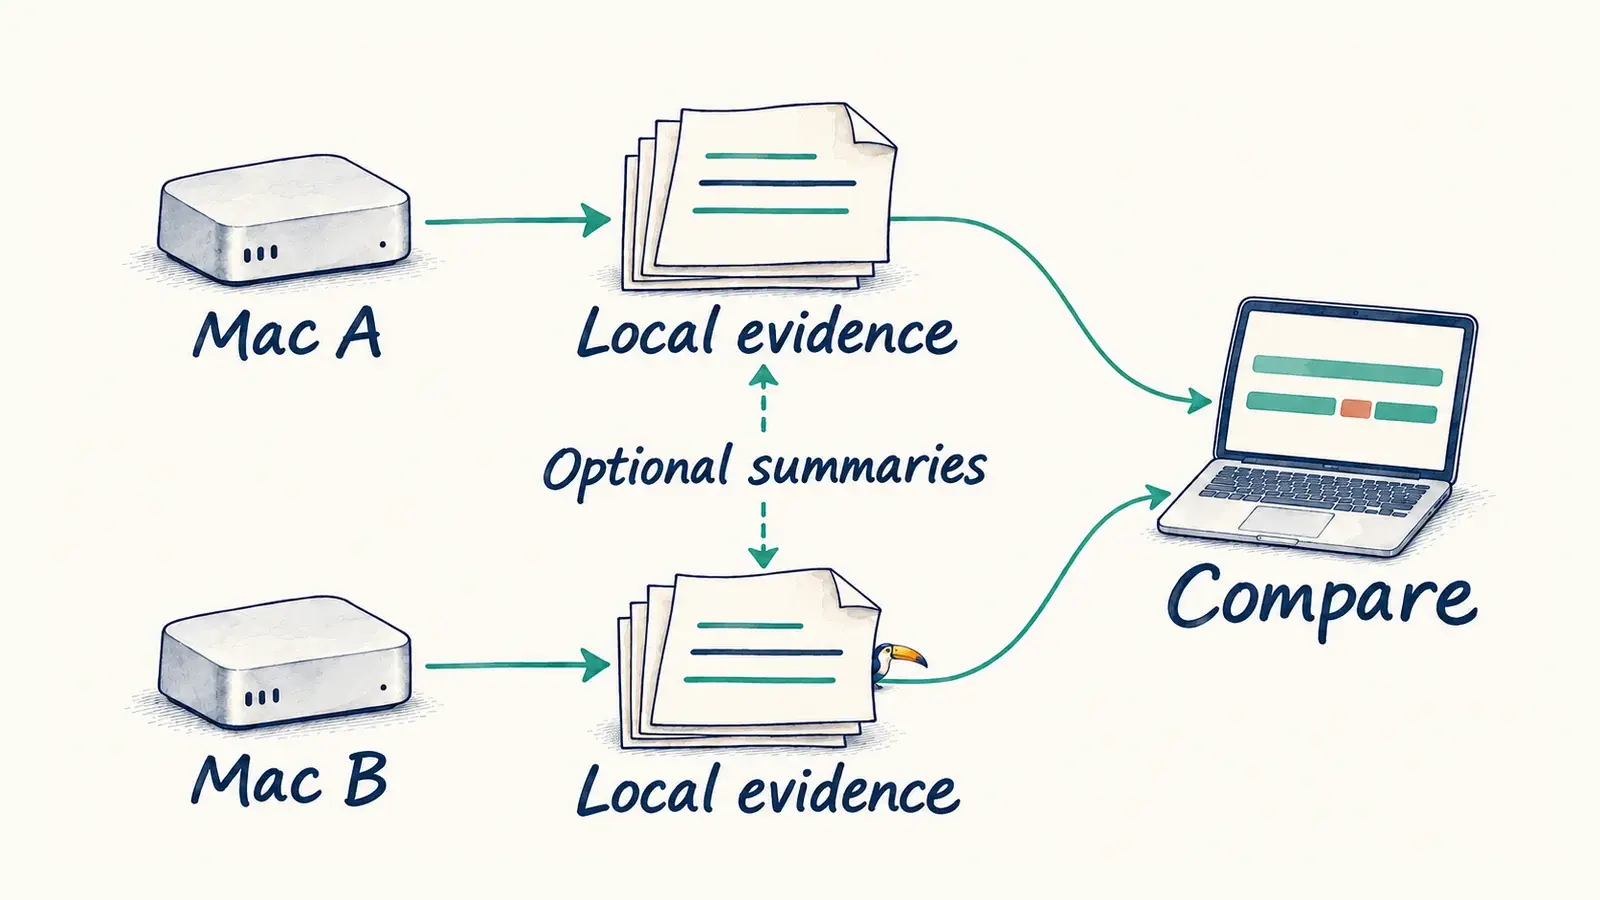
The system separates evidence collection from its presentation. The architecture builds up in three views.
A background Python recorder checks the router, gateway and public destinations. By default, a cycle starts about every 15 seconds. Ping, TCP, DNS and certificate-validated HTTPS checks answer different questions about the path. Measurements and events are appended to rotating JSONL journals; the latest state is saved as an atomic checkpoint.
The SwiftUI dashboard loads evidence away from its main interface thread and reads new journal entries incrementally. Closing its window leaves the recorder running. The command-line interface provides another way to read the same saved evidence, including a versioned JSON briefing for an agent running locally. A query starts no new probes or speed tests.
One Mac provides the full recording and viewing workflow. A second can observe a different path, such as Ethernet beside Wi-Fi. Each records independently. Exported snapshots support an offline comparison; optional sharing workers exchange compact summaries over mutually authenticated TLS and retain validated peer caches. Raw journals stay on their original Macs.
Configured device replies, Wi-Fi readings, observer CPU and memory context, interface activity and bounded investigations add context with separate timestamps. Device replies establish local reachability, subject to identity uncertainty. They do not establish camera video, voice-assistant cloud access or another application’s health.
Retention is bounded by age and size. The per-user recorder resumes after login; it does not run before login or keep a sleeping Mac awake.
Reading the evidence
With the default thresholds, two consecutive failed samples confirm a check incident and two consecutive successful samples confirm recovery. The record preserves the first failed and recovered observations. These are sampled times, so events between checks can be missed and recording gaps make duration uncertain.
Compare overlapping observations from both Macs before attributing a problem to a shared path. Clean public probes cannot clear a separate meeting computer or Zoom’s media path. A failed ping alone does not establish a device outage or identify faulty equipment.
Throughput comes from separate bandwidth tests on the observing Mac’s path. It is not per-device usage or a measurement of Wi-Fi speed in every room. Missing measurements remain unknown.
Build it and inspect it
Network Monitor is an MIT-licensed source release for Apple Silicon Macs running macOS 14 or later. Building requires Python 3.10+ and Apple’s Command Line Tools. The repository includes setup instructions, the architecture, interpretation rules and synthetic fixtures. A notarized installer is not provided.
← Back to all projects