Projects
Preparing the portfolio shell before the interactive work loads.
Preparing the portfolio shell before the interactive work loads.
Network Monitor · Documentation
How the Python recorder, local evidence journals, native dashboard, read-only CLI and optional second observer fit together.
A Python recorder runs independently of the dashboard as a per-user background job. Each observer writes its own evidence on the same Mac. There is no database server or cloud control plane. A failed network check can still be recorded locally while the Mac is awake and the recorder is running.
By default, a probe cycle starts about every 15 seconds. A limited thread pool checks the router, gateway and public destinations with ping, TCP, DNS and certificate-validated HTTPS. These protocols answer different questions; one successful check cannot stand in for every other path.
With the default thresholds, the detector confirms a check incident after two consecutive failed samples and recovery after two consecutive successful samples. It preserves the first observed failure and recovery as well as their confirmation times. Recording gaps remain explicit.
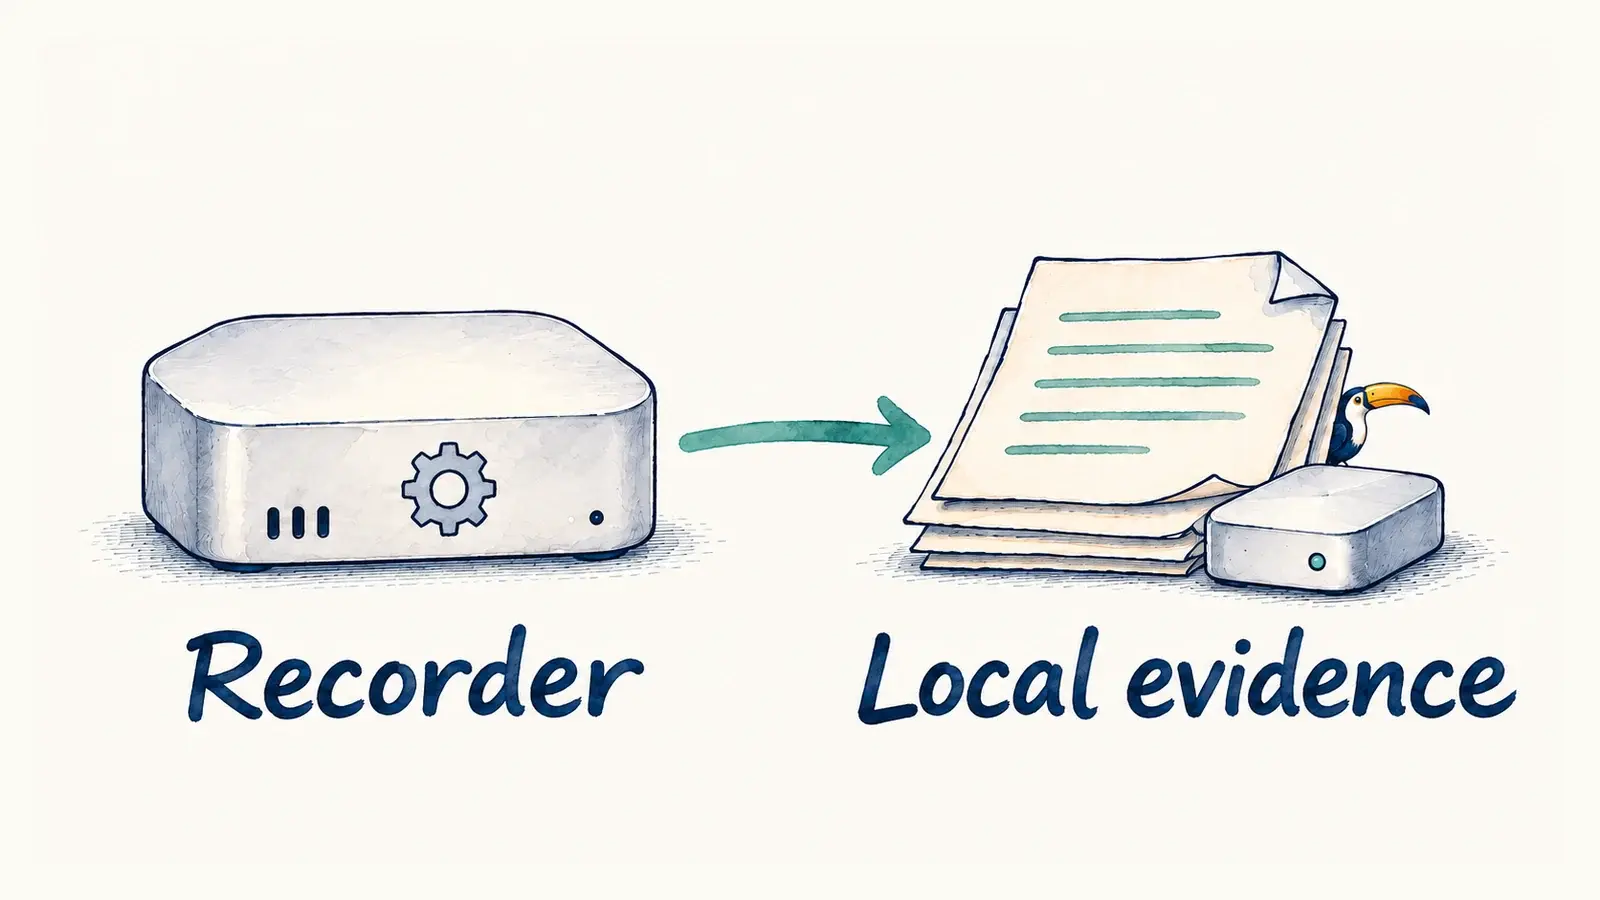
| Component | Responsibility |
|---|---|
monitor.py | Validate configuration, run bounded probes, detect incidents and persist records. |
devices.py | Track configured devices and available identity evidence. |
diagnostics.py, host_metrics.py | Collect supplemental gateway and observer context, with separate timestamps and failure handling. |
performance.py | Schedule bandwidth tests and serialize them within each observer’s slot. |
investigation.py | Run bounded close-ups and optional diagnostic tools without letting their failure stop primary collection. |
analysis.py, agent_query.py | Summarize saved observations for read-only queries. |
The native app uses SwiftUI and Charts. DashboardData.swift decodes and validates evidence; DashboardStore.swift loads it away from the main interface thread. Incremental offsets avoid rereading the full journal on every refresh. Rotation removes old offsets, and charts preserve unknown periods.
The dashboard refreshes every five seconds and slows while hidden. Closing it does not stop recording. Explicit controls can request investigations, bandwidth tests or recorder changes; those actions are separate from an ordinary evidence read.
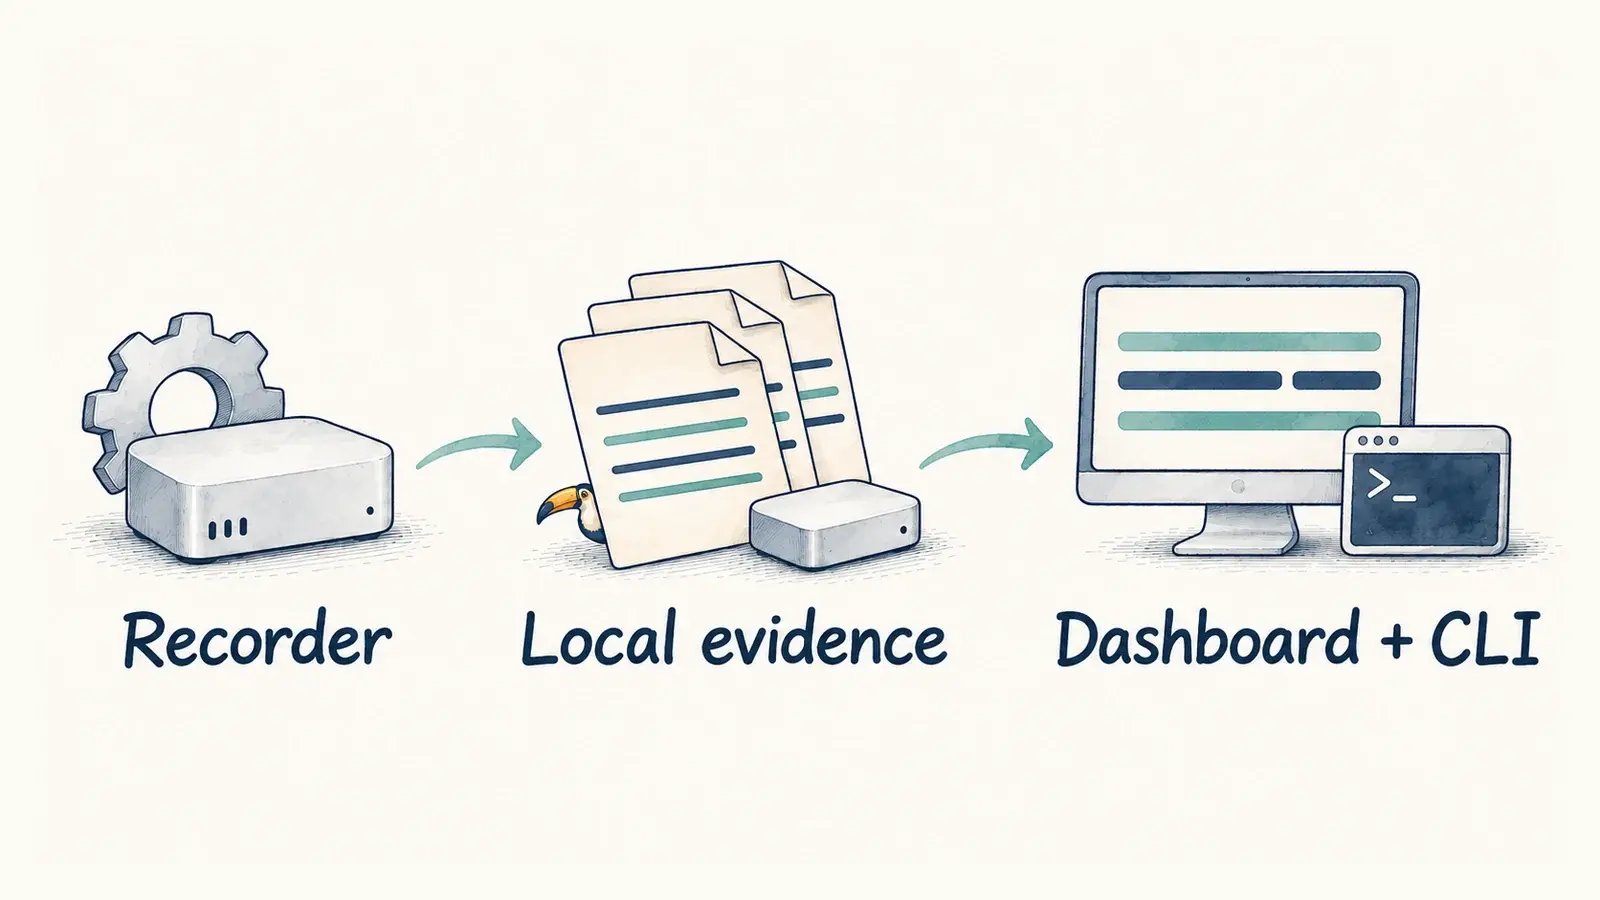
The installed CLI offers another reader, including a versioned JSON briefing for a local agent.
~/.local/bin/network-monitor query --hours 24This command starts no probes or speed tests. An agent needs local command access; the app does not automatically register a cloud connector, and no API key is required.
One Mac provides the complete recording and viewing workflow. A second adds another vantage point, such as Ethernet beside Wi-Fi. Neither recorder depends on receiving the other’s evidence. Export and import support an offline snapshot comparison.
Optional sharing uses separate workers in sync.py and peer_transport.py. Each publishes compact summaries and exchanges validated evidence over mutually authenticated TLS. Raw journals stay on their source Mac.
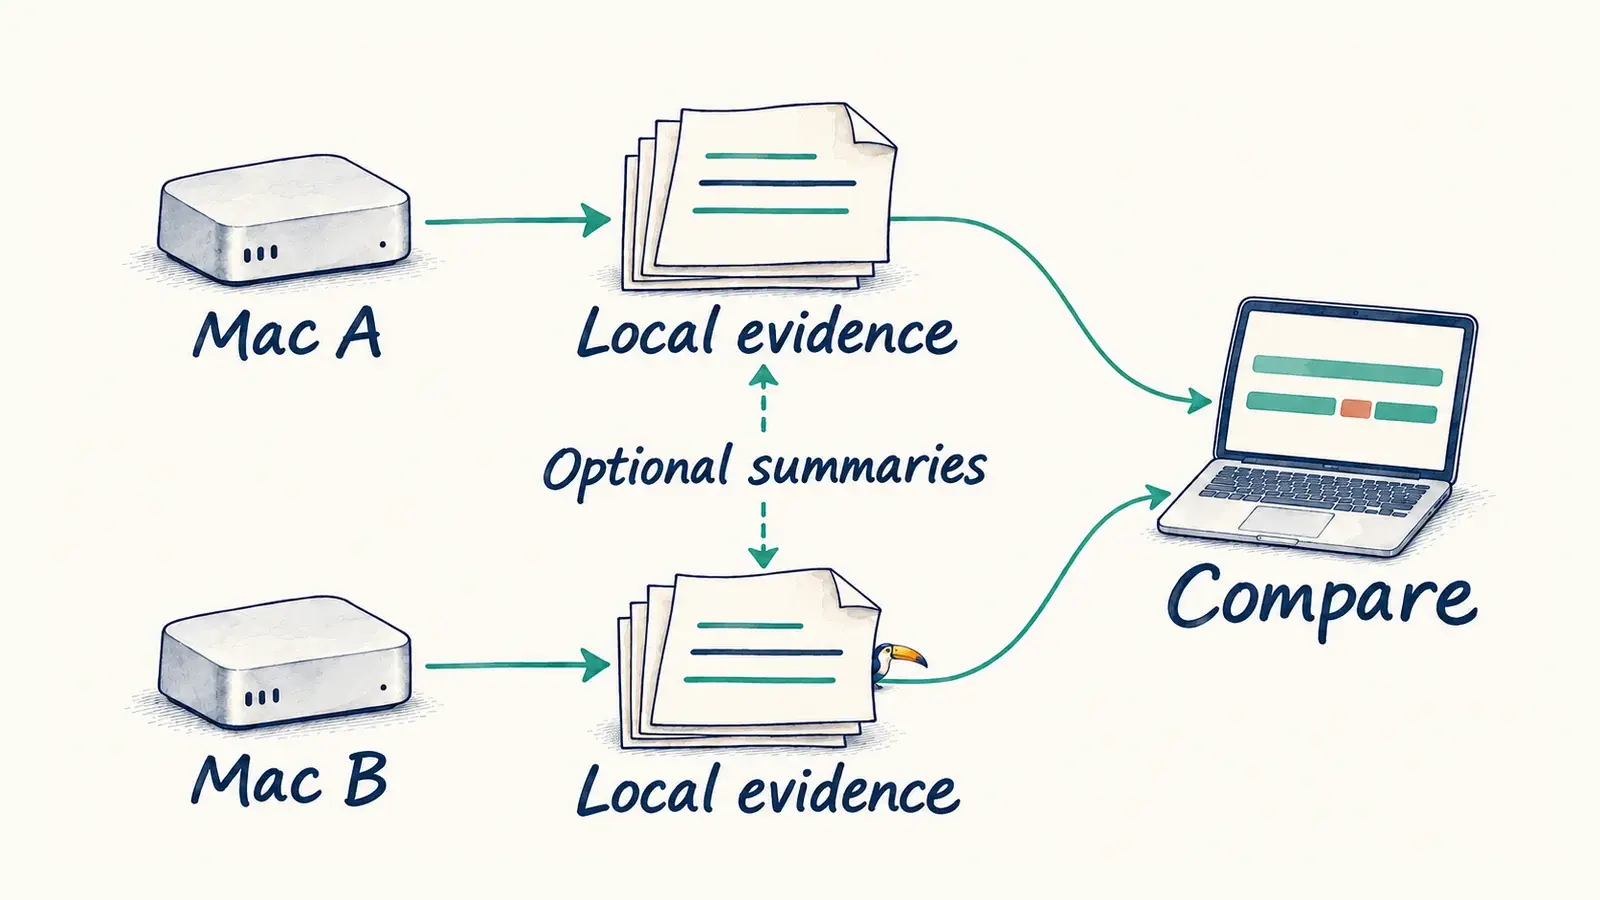
The implemented automatic transport requires LocalHostNames Mini-One and Mini-Two on 10.0.0.0/24. Mini-One accepts a restricted LAN connection and Mini-Two initiates it; summaries travel both ways. Public-certificate pairing, fingerprint verification and explicit enablement precede transfer. General discovery and automatic pairing are not implemented. The repository’s sharing setup reference ↗ describes this optional transport in detail.
A failed transfer leaves the last valid peer cache available. The time a peer observed a result remains separate from the time it arrived. Missing or stale peer evidence means its current health is unknown.
A private pending marker precedes compact appends. If the worker exits before committing its cursor, the next publication rebuilds compact summaries from retained journals in a new recording generation. The peer keeps its prior generation separately. Rebuilding cannot restore history that retention has already removed.
Cache swaps hold an exclusive file lock. Native readers use a nonblocking shared lock and retain the last complete snapshot during a transfer. CLI queries hold a shared lock while reading the selected cache generation. Corrupt or unavailable peer evidence does not prevent local queries from returning local observations. Transfers have byte limits, record-count limits and deadlines.
Measurements and events are appended to rotating JSONL files. Writers use locks, flush and fsync, bounded records and torn-tail recovery. Checkpoints use unique owner-only temporary files followed by atomic replacement. Configuration, imported snapshots and caches have size and shape limits.
A journal and its checkpoint are separate writes, not a transactional database. Sudden failure can leave a journal record newer than the checkpoint. Restart evidence and gaps matter when interpreting incident boundaries.
| Evidence | Size | Age |
|---|---|---|
| Primary samples | 256 MiB | 30 days |
| Events | 16 MiB | 180 days |
| Speed tests | 8 MiB | 180 days |
| Human observations | 4 MiB | 180 days |
| Diagnostics | 32 MiB | 30 days |
| Investigations | 32 MiB | 30 days |
Whichever ceiling is reached first limits retention. State, service errors and optional caches add bounded overhead. User exports, builds, Trash and migration backups sit outside automatic retention. The dashboard keeps seven days of compact samples and up to 180 days of speed and observation records in memory.
| Location | Contents |
|---|---|
~/Library/Application Support/NetworkMonitor | Installed runtime, private settings and optional sync cache. |
~/Library/Logs/NetworkMonitor | Current state and rotating raw journals. |
~/.local/bin/network-monitor | Installed command-line entry point. |
~/Applications/Network Monitor.app | Native dashboard. |
Sampled coverage is not continuous uptime. A gap cannot be reconstructed, and a stale result cannot establish present health. Supplemental Wi-Fi, CPU, memory and gateway readings have their own timestamps.
Local device replies do not prove camera video or a voice assistant’s cloud connection works. An address reply without verified identity can belong to a reused DHCP address. Clean public checks cannot clear a separate meeting computer or Zoom’s actual media path.
Throughput tests measure the observing Mac’s path, not per-device usage or Wi-Fi speed in every room. Satellite management replies do not measure backhaul throughput. Comparisons can narrow an investigation without identifying a physical cause automatically.